
Software

Analysis graphs for score courses

On a score course every competitor picks their own controls in their own order, so the usual split graphs have nothing to compare. meshO Manager's spectator site and kiosk now have a set of graphs made for score courses: which controls paid, which routes the leaders took, how the field spent its time, and who came back late.

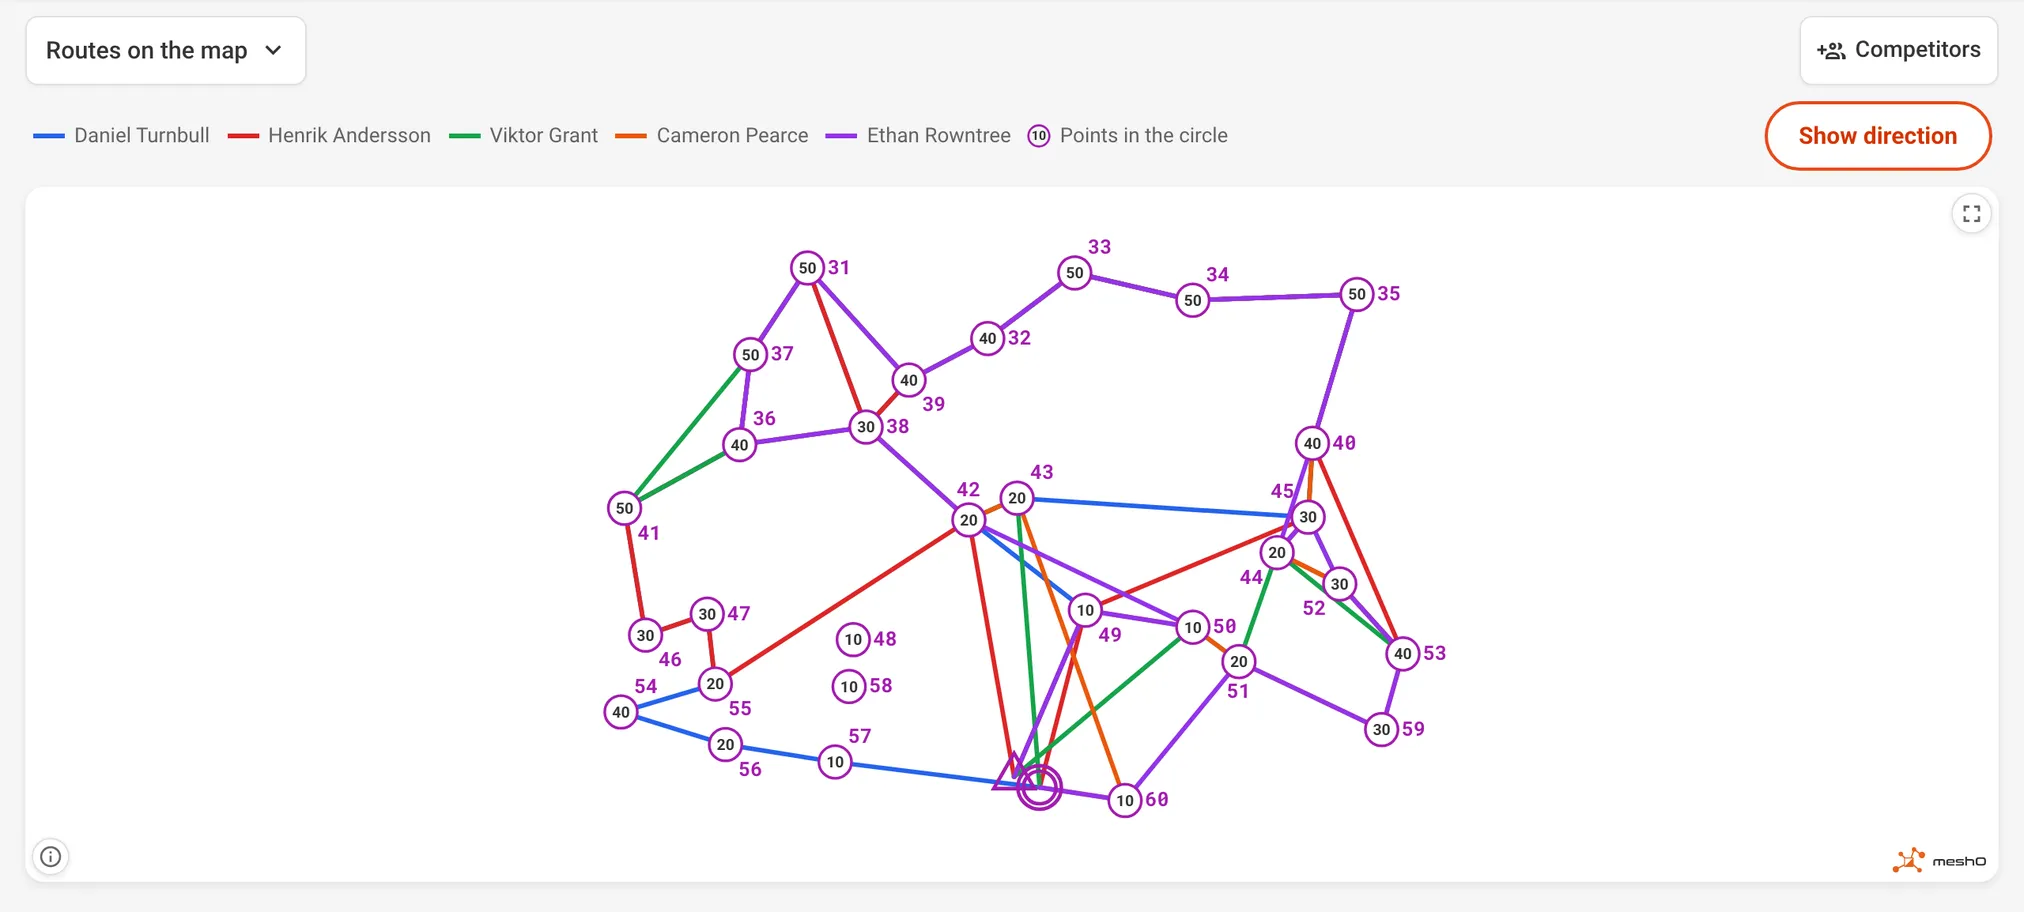
Routes on the map for a 45-minute score course: the course drawn in purple, each control's points written inside its circle and its number beside it, the start triangle and the finish double circle near the bottom, and the routes of the top five competitors, Daniel Turnbull, Henrik Andersson, Viktor Grant, Cameron Pearce and Ethan Rowntree, as straight coloured lines between the controls they punched.
Routes on the map: the top five competitors' routes over the course, with each control's points inside its circle.

After a line course, the conversation at the finish is about splits: where you lost time, and who was fastest between 7 and 8. After a score course it’s a different conversation. Which controls did you get? Was 35 worth going out for? Did you make it back in time?

meshO Manager’s analysis graphs used to have nothing to say about that. Every one of them compares legs, and on a score course nobody runs the same legs. Now a score course gets its own set of graphs, sixteen of them, on the spectator site that competitors open on their phones and on the kiosk at the arena.

Every picture here is from the sample score event that comes with Manager: six classes of 100 competitors on one 45-minute course of 30 controls, worth 10 to 50 points each, with 10 points off for every minute late. You can add it from Try a sample event on the Events page and look at every graph yourself.

Which controls paid?

Control popularity counts how many competitors visited each control, shaded by what it was worth. The darkest bars are the 50-pointers.
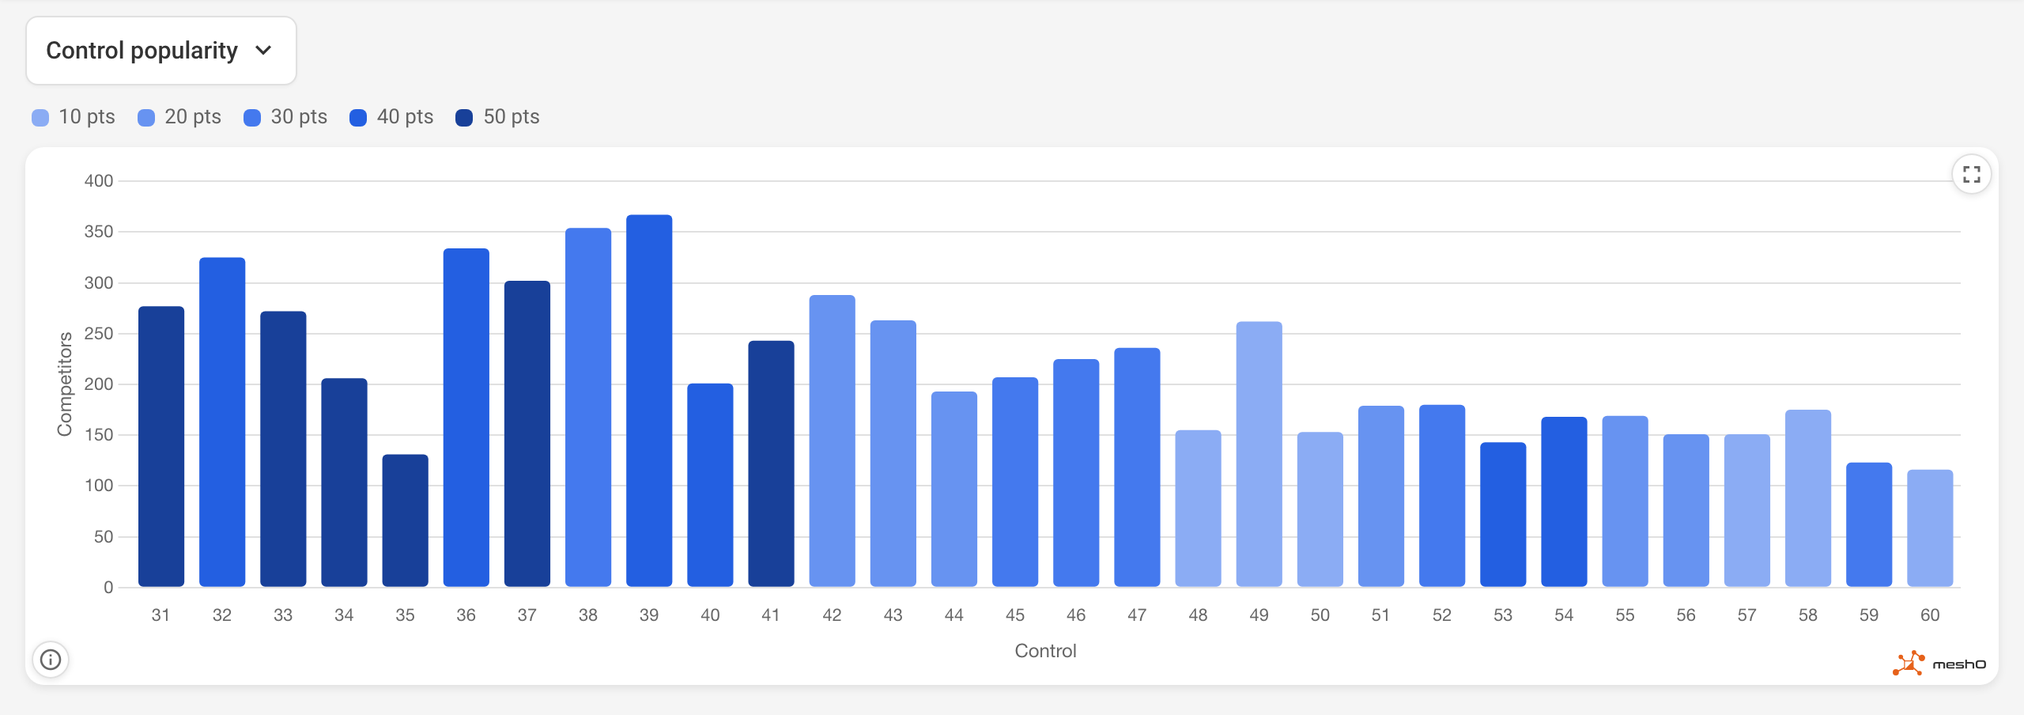
Control popularity: a bar for each control from 31 to 60, its height the number of competitors who visited it and its shade of blue what it was worth, from 10 to 50 points. Controls 38 and 39 were visited by about 350 competitors each, and 35, a 50-point control, by about 130.
Control popularity. 38 and 39 were visited by more than half the field. 35, worth 50, by only about 130 competitors.

Points against popularity puts the same numbers on two axes: what a control was worth across, and the share of the field that visited it up. A control high on the left was cheap but everybody went anyway, because it was on the way. A control low on the right was dear and out of reach.
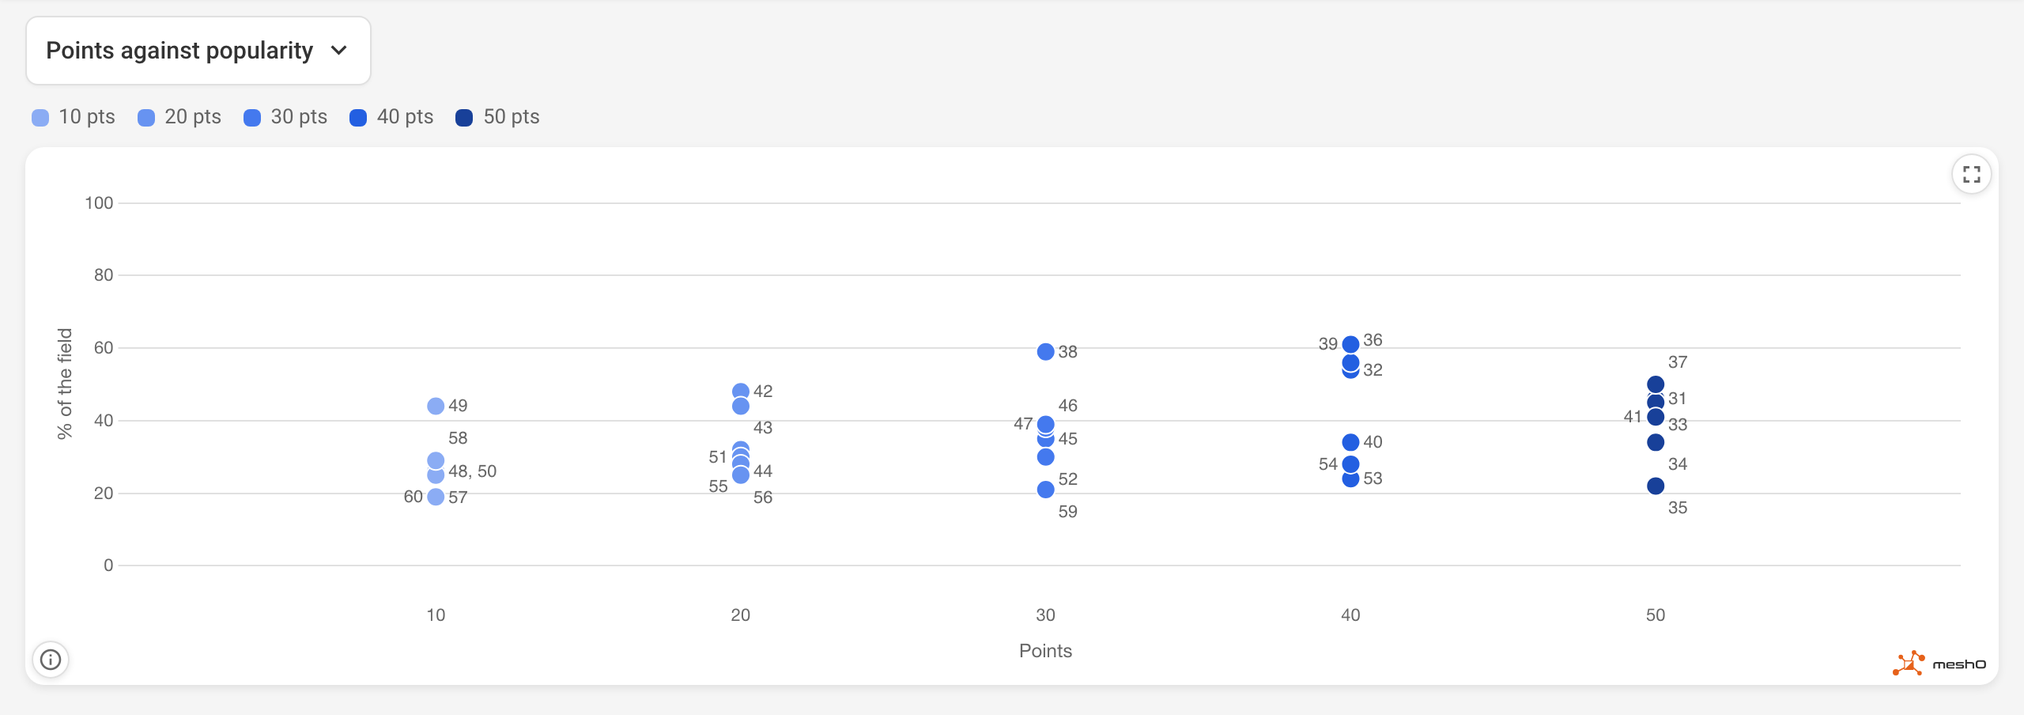
Points against popularity: one dot per control, its points (10 to 50) across and the percentage of the field that visited it up. 38 is the most visited 30-point control at about 60%, and 35 the least visited 50-point control at about 20%.
Points against popularity. 39 and 36, worth 40, were taken by 60% of the field. 35, worth 50, by about one in five.

What the leaders took compares the top tenth of the field with everyone else, control by control. Here 33, 34 and 32, the 50- and 40-pointers along the top of the map, were visited by 50 to 60 percentage points more of the leaders than of everyone else. That’s the race in one picture: the winners went north.
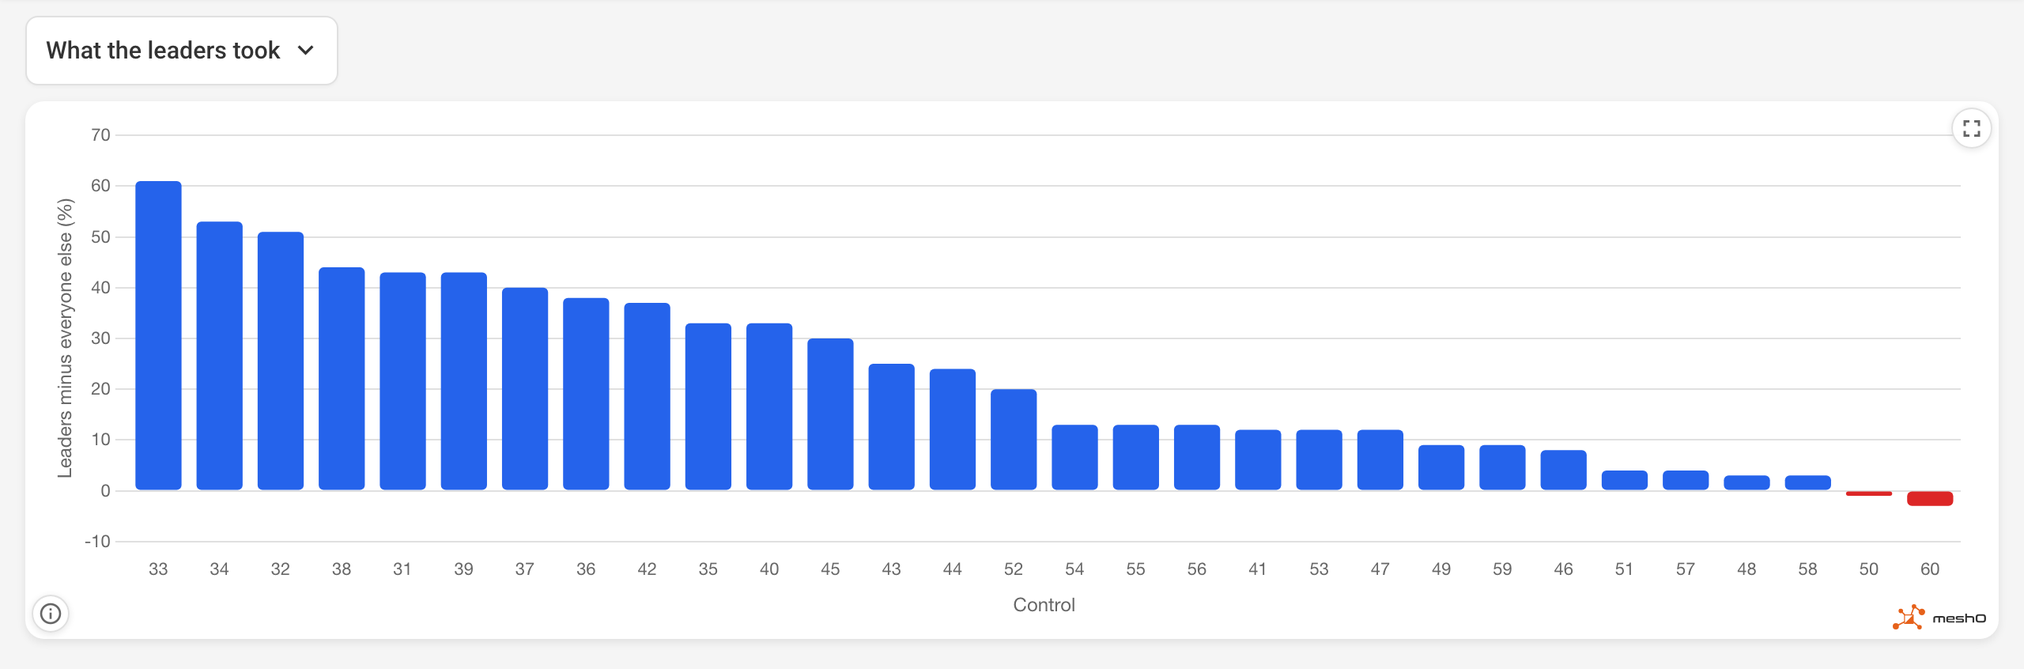
What the leaders took: a bar for each control, how much more often the top tenth of the field visited it than everyone else, in percentage points. 33 is highest at about 60, then 34 and 32 at about 50, falling away to 50 and 60, which the leaders visited slightly less often than the rest.
What the leaders took. 33, 34 and 32 separate the top of the field from the rest.

Which way did they go?

Busiest legs draws every leg anybody ran over the course in purple, with each control’s points inside its circle. The more competitors ran a leg, the thicker its line. Show direction splits each leg into the ways it was run, with two barbs pointing the way.
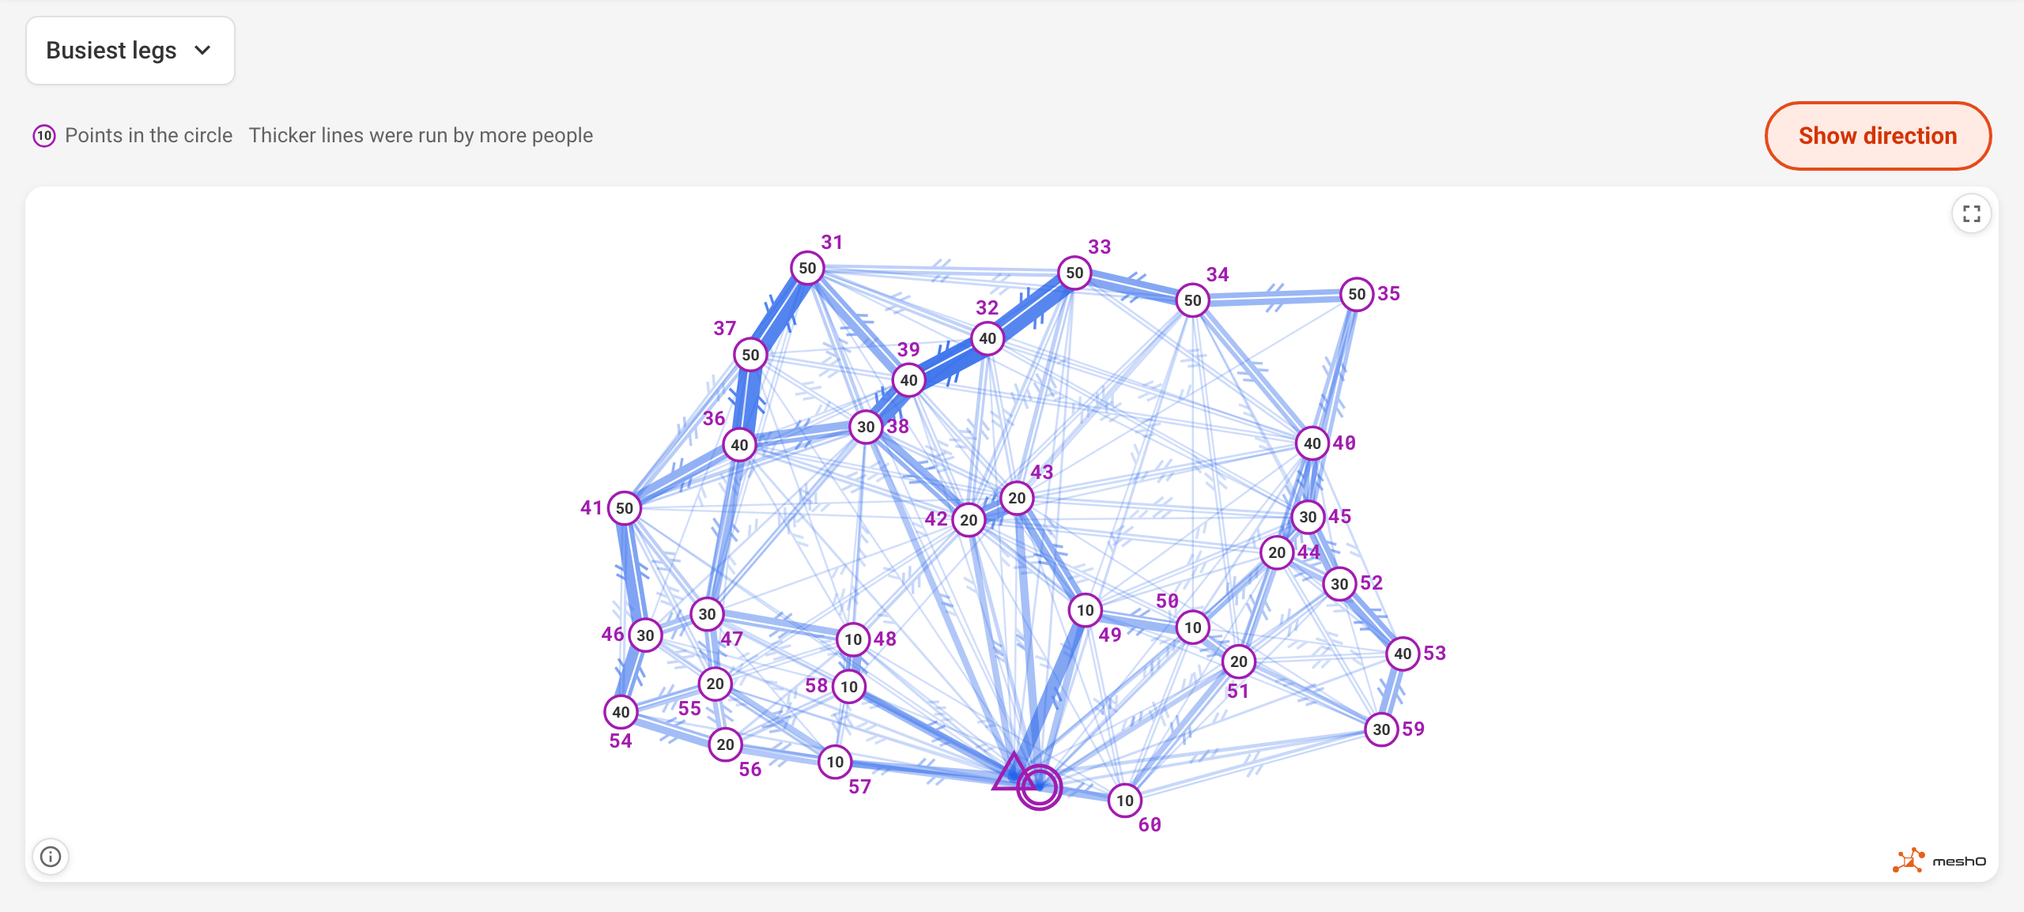
Busiest legs with Show direction on: the course in purple, the start and finish at the bottom, and a web of blue lines between the controls, thicker for the legs more competitors ran, each carrying small double barbs that point the way it was run. The thickest lines run along the top through 31, 37, 38, 39, 32 and 33.
Busiest legs, with Show direction on. The thick lines across the top are the 50-point loop through 31, 37, 39, 32 and 33.

Route families groups competitors by the part of the course they left out, and names each group after its best competitor. “Like Simon Keller” is the most common way round the course; “Like Daniel Turnbull” is the winner’s, chosen by far fewer people, and it scored more.
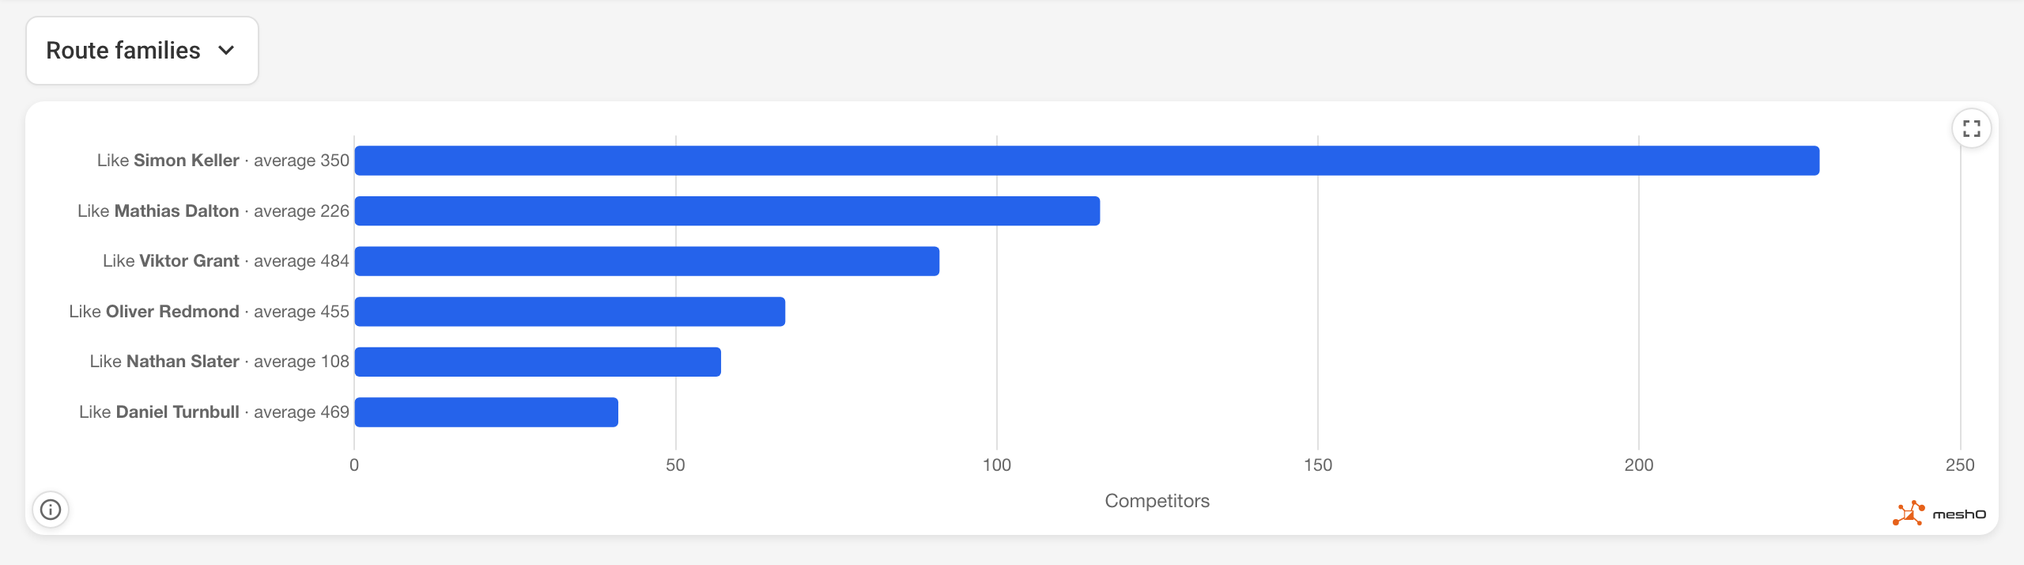
Route families: six horizontal bars, each a group of competitors who left out the same part of the course, named after its best competitor with the group's average score. Like Simon Keller, average 350, has about 230 competitors. Like Daniel Turnbull, average 469, has about 40.
Route families. The most popular way round averaged 350 points; the winner’s way averaged 469.

Routes in order has a row for each competitor: their controls in the order they took them against the clock, a bigger dot for a dearer control, their total beside their name, and the time limit as a dotted line.
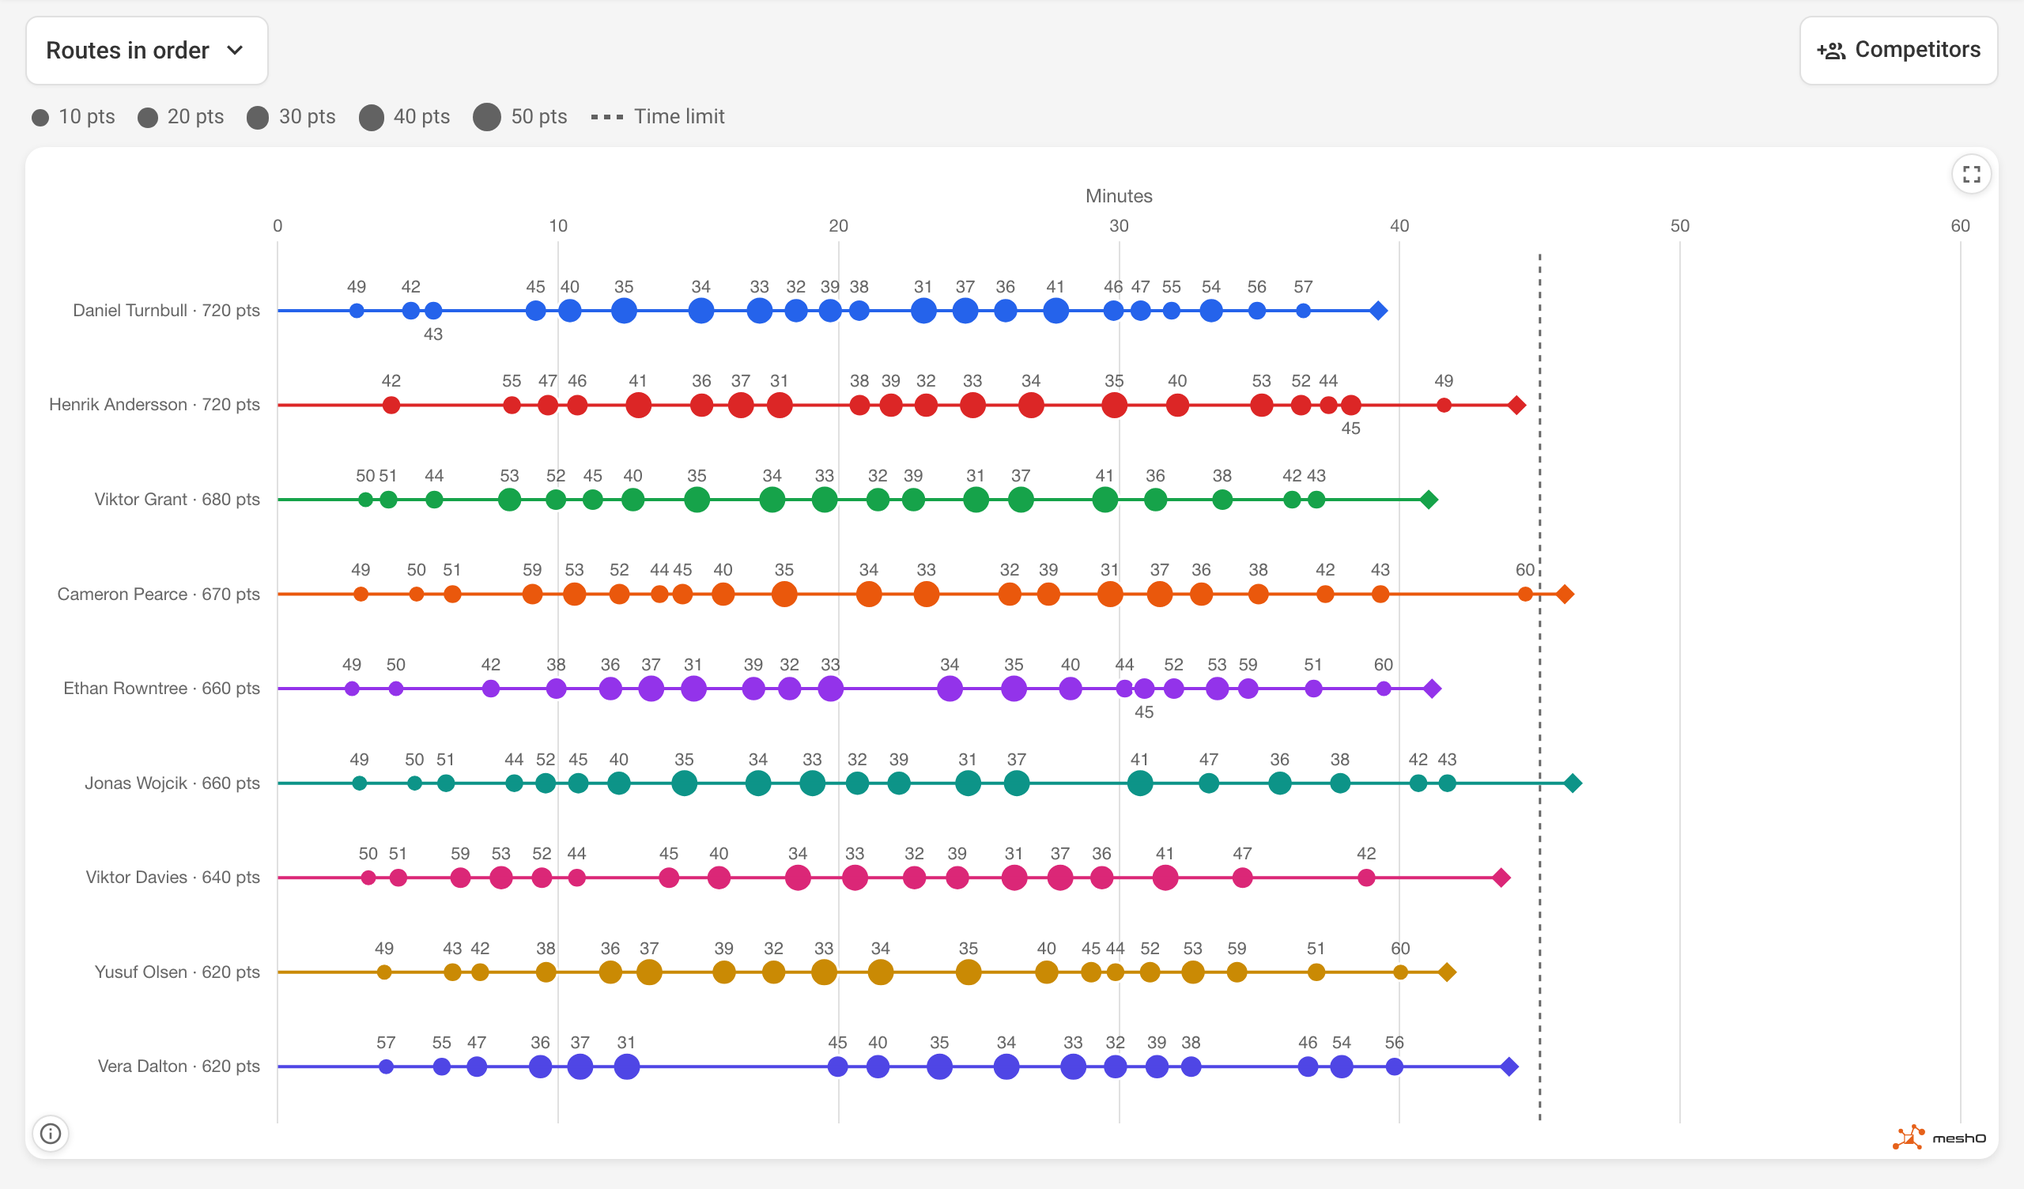
Routes in order: a row for each of the top nine competitors against minutes from 0 to 60, with a dot at each control they visited, labelled with its number and bigger for more points, and a dotted line at the 45-minute limit. Daniel Turnbull, 720 points, finished at about 39 minutes; Henrik Andersson, also 720, at about 44; Cameron Pearce and Jonas Wojcik finished past the limit.
Routes in order. Daniel Turnbull and Henrik Andersson both scored 720; Turnbull was back five minutes sooner and won on time.

How did they spend their 45 minutes?

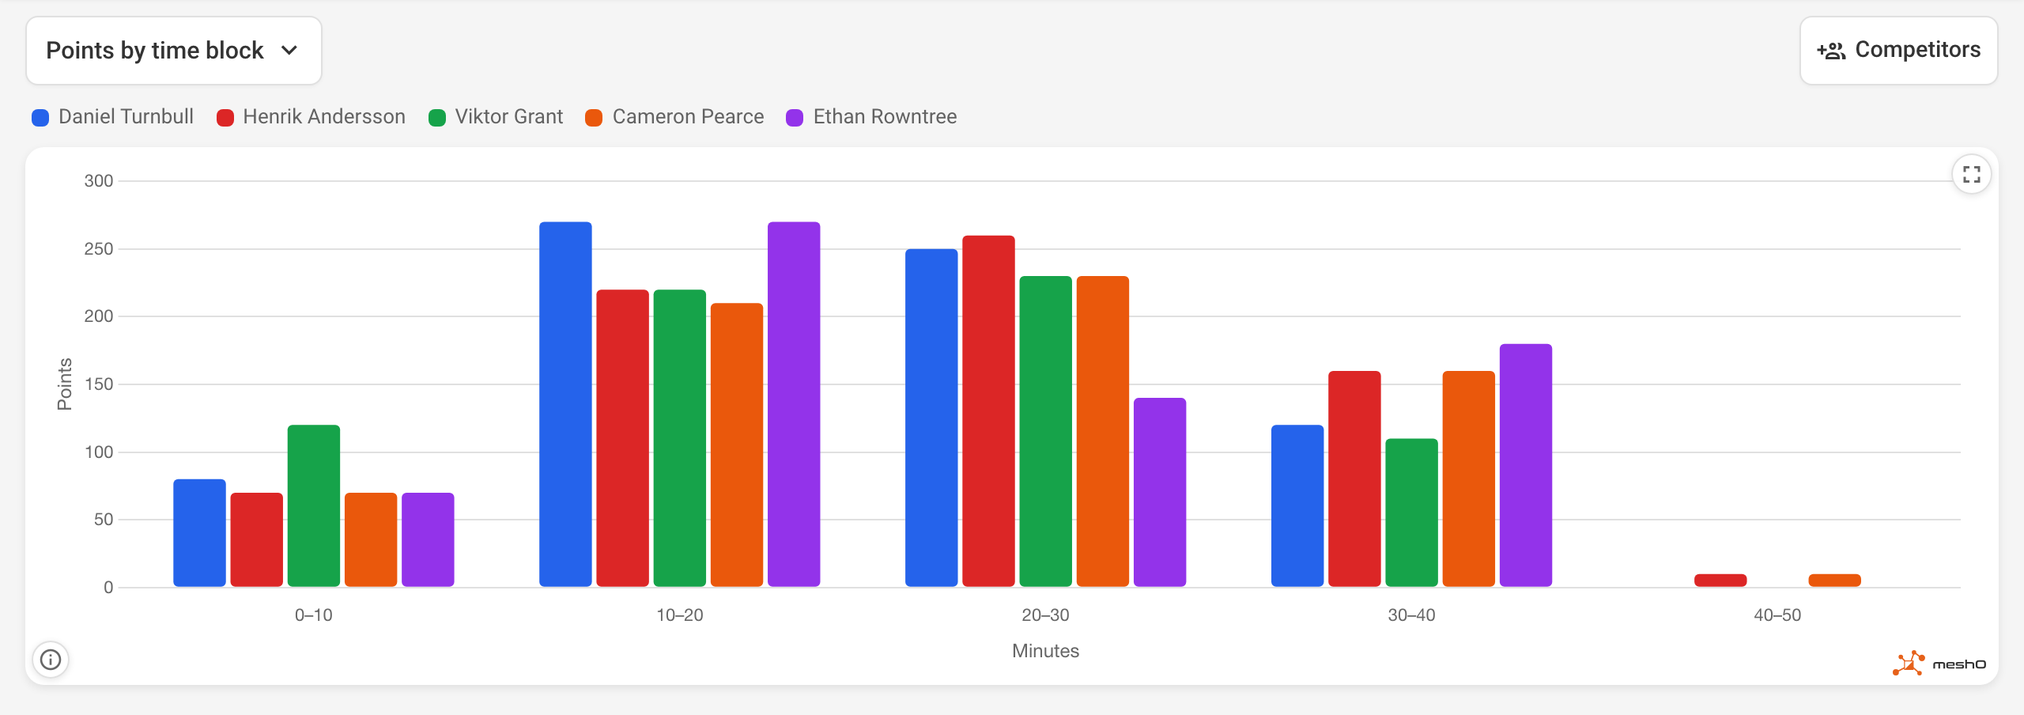
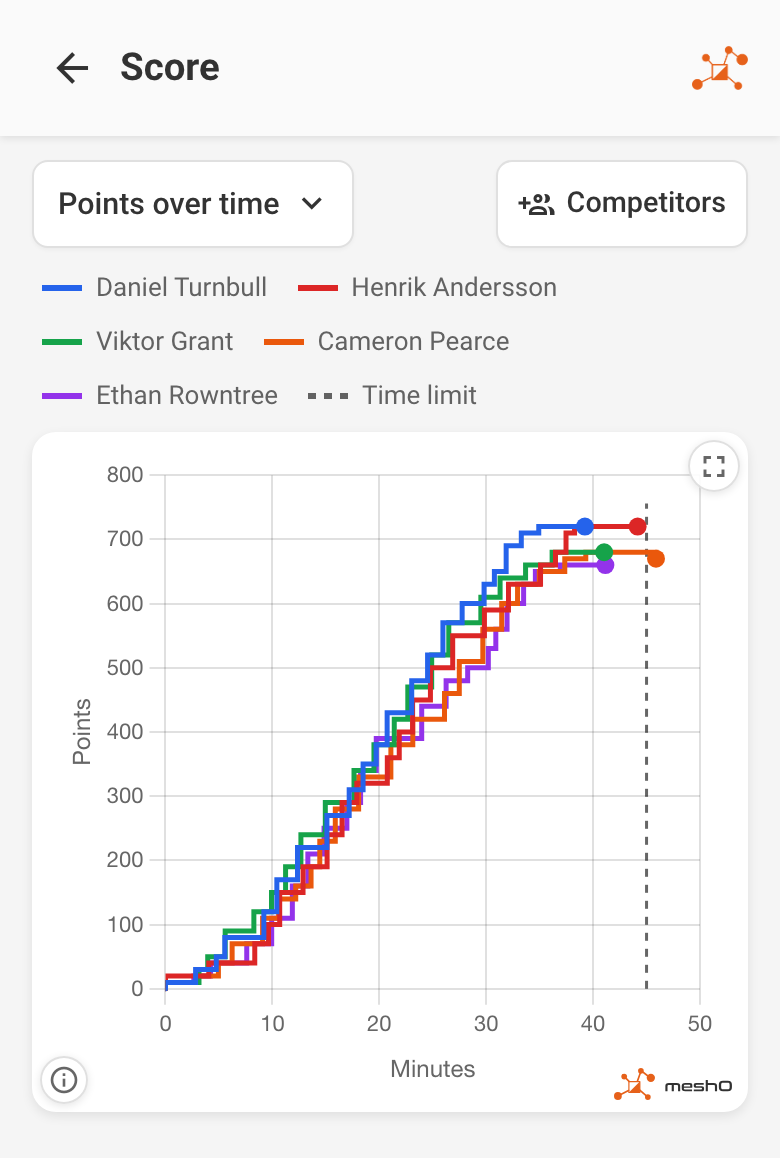
Points over time draws each picked competitor’s score climbing as they punch, with the limit marked. The leaders are level for half an hour; the race is decided in the last ten minutes. Points by time block shows the same in ten-minute blocks.
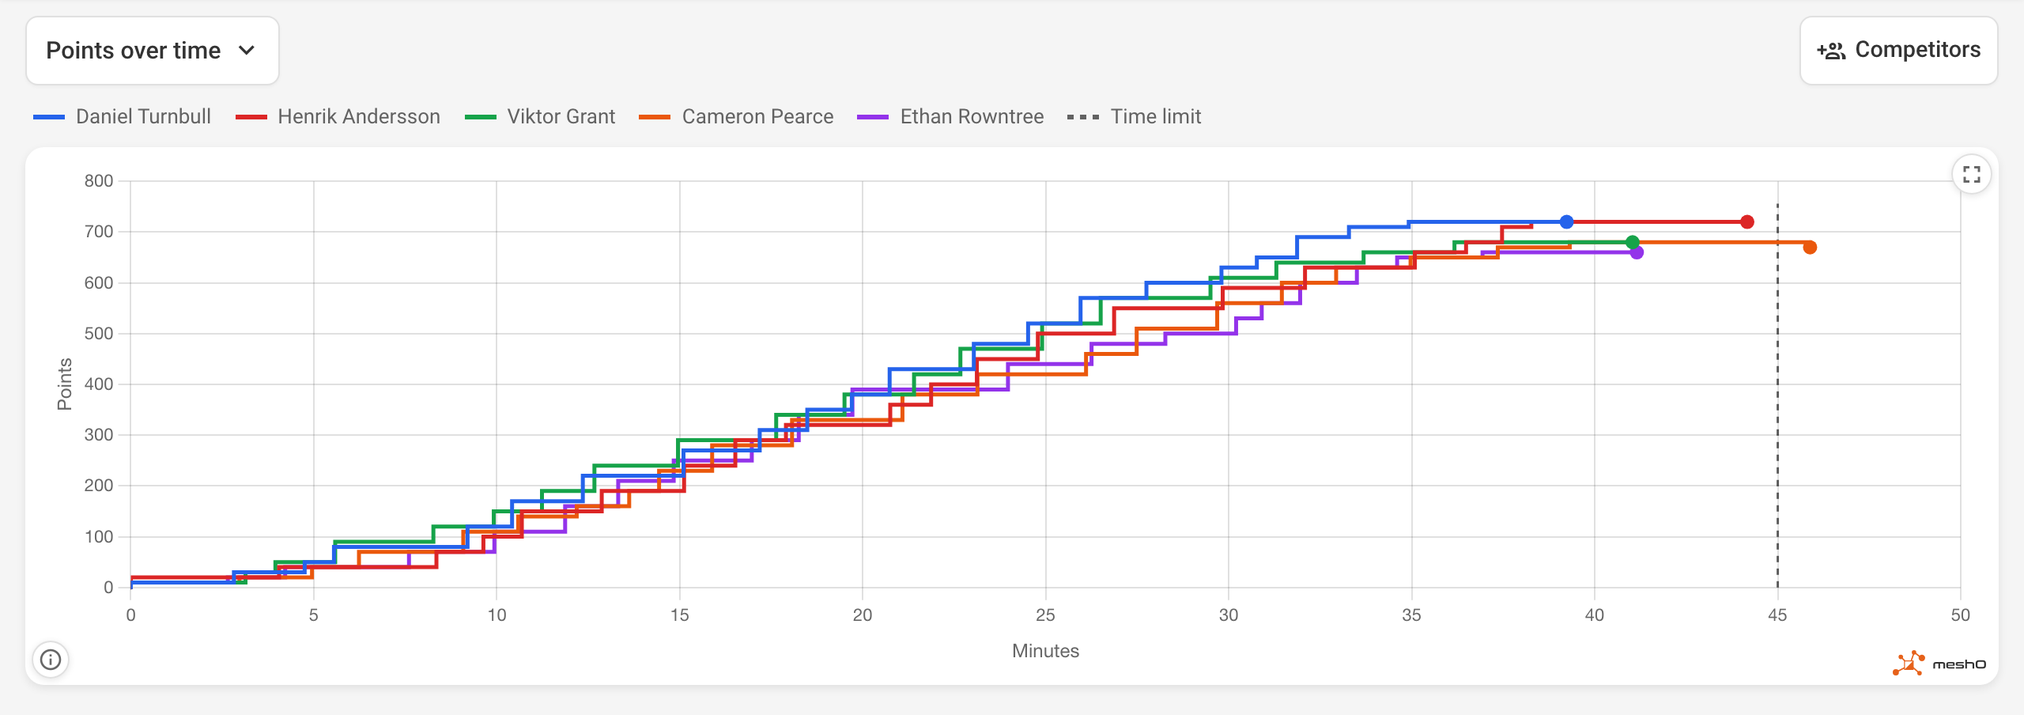
Points over time: five stepped lines, one for each of the top five, climbing from 0 to between 660 and 720 points over 40 to 46 minutes, with a dotted line at the 45-minute time limit. The lines stay close together until about 30 minutes, then separate.
Points over time. Five competitors within a few controls of each other for 30 minutes.
Points by time block: grouped bars for the top five competitors in each ten-minute block. Each scored 70 to 120 points in the first ten minutes, 210 to 270 in each of the next two blocks, and 110 to 180 from 30 to 40 minutes. Only Henrik Andersson and Cameron Pearce scored after 40 minutes.
Points by time block. The middle twenty minutes are where the points are.

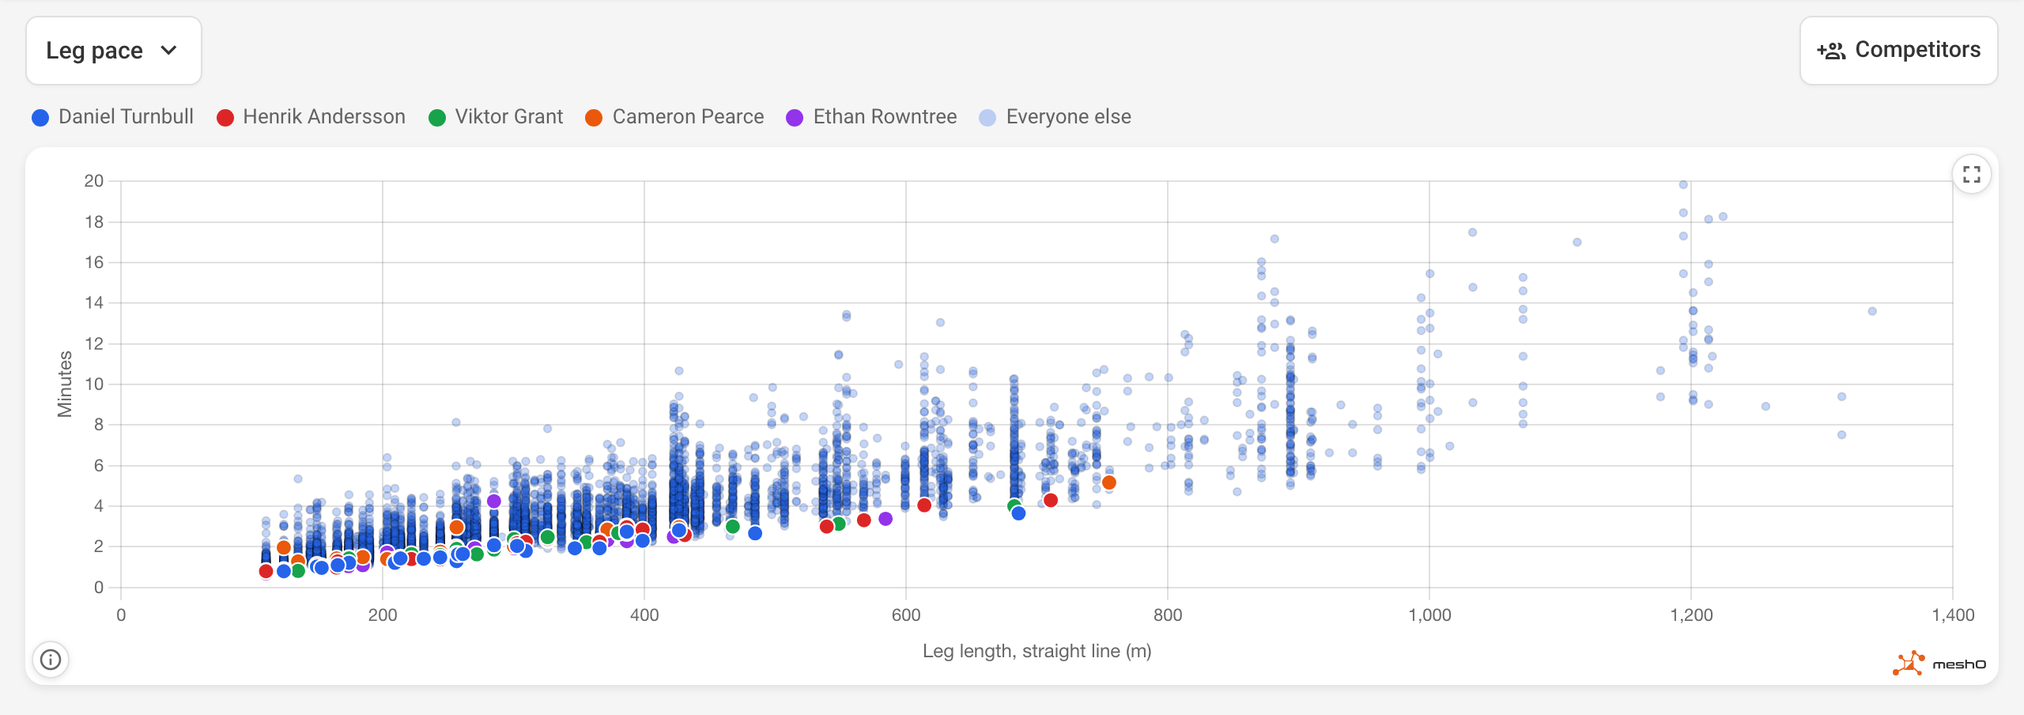
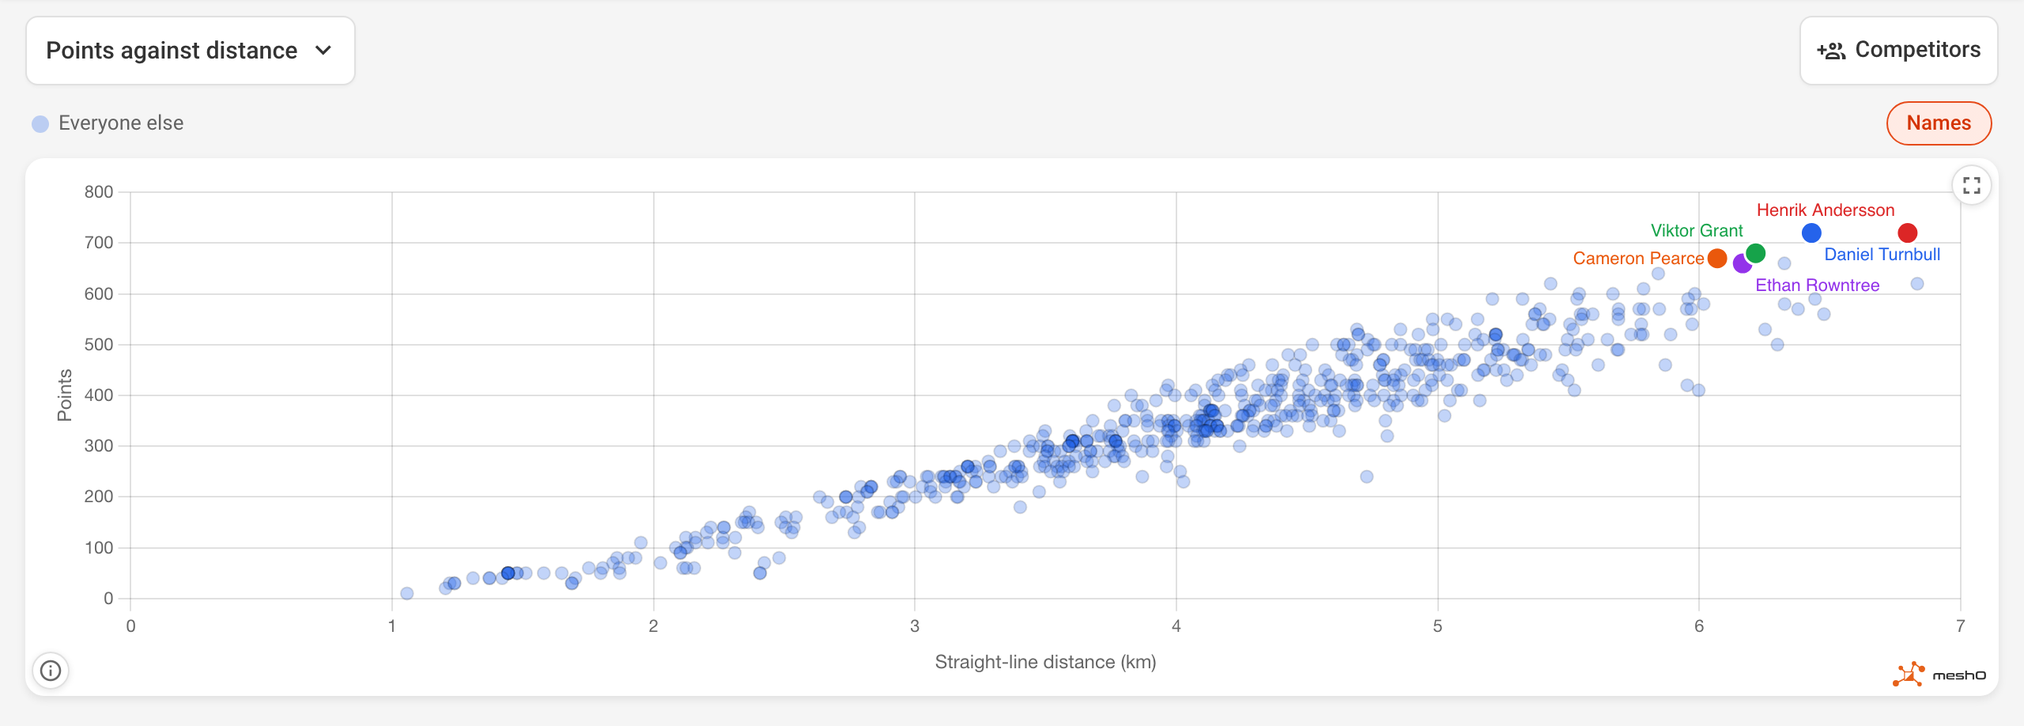
Points against race time and Points against distance put the whole field on one graph, with the picked competitors named. Distance is straight lines between the controls, so it isn’t the distance anybody ran, but it shows who scored a lot without going far. Leg pace shows how long each leg took for its length.
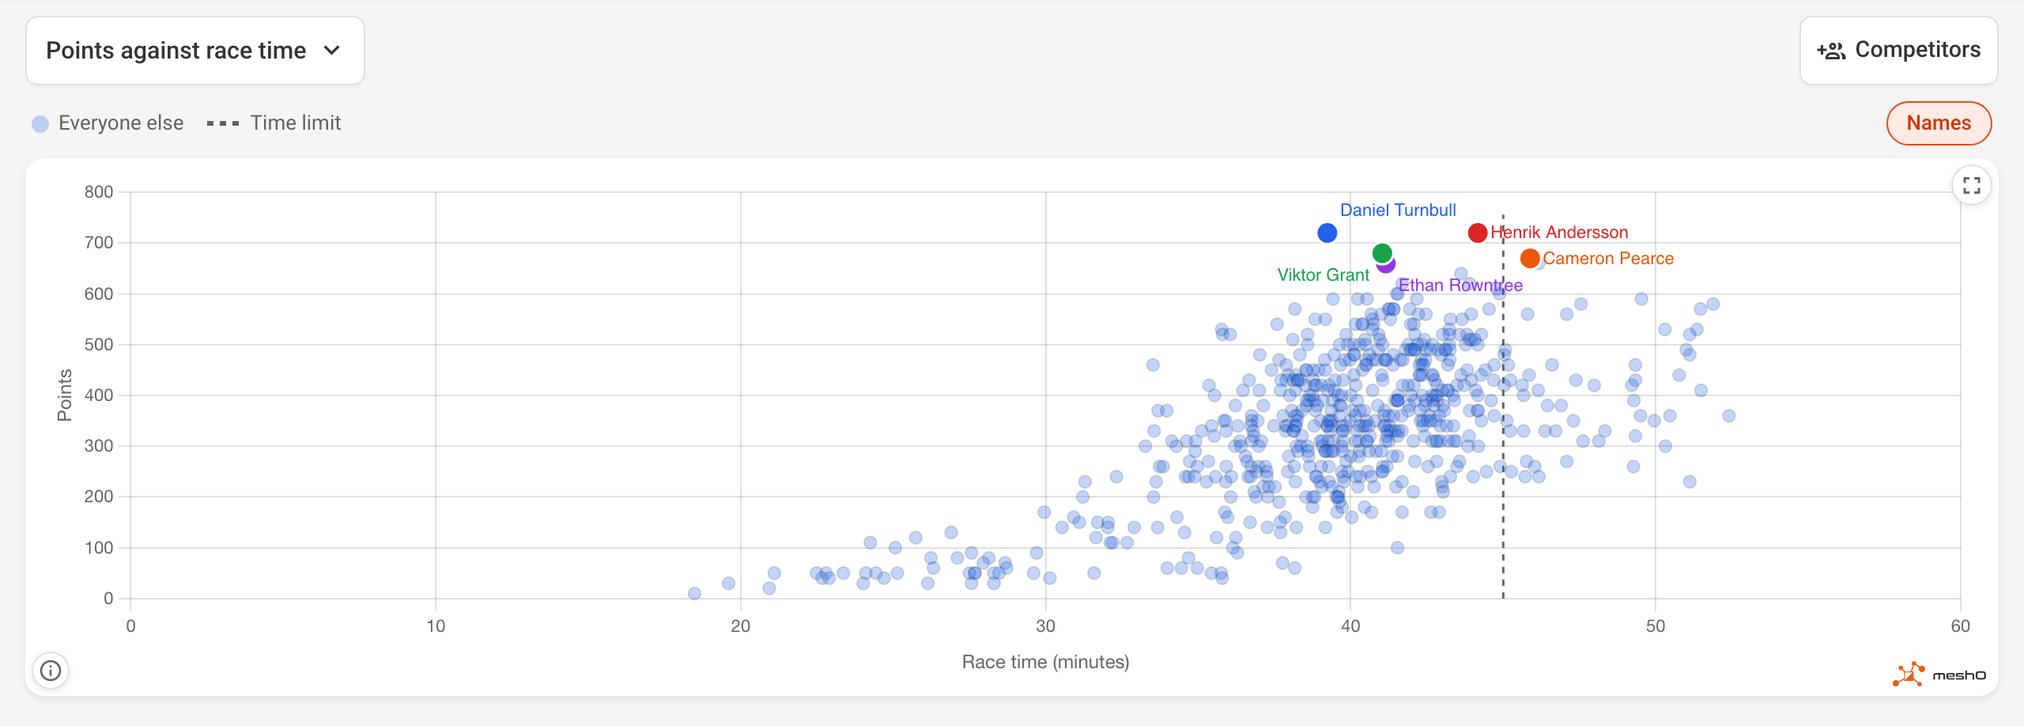
Points against race time: one faint dot per competitor, points up and race time across, most of the field between 30 and 50 minutes and 200 and 600 points, with a dotted line at 45 minutes. The top five are coloured and named above the cloud between 39 and 46 minutes.
Points against race time. The field bunches against the limit, and the winners sit on top of it.
Points against distance: one faint dot per competitor, points up and straight-line distance across from 1 to 7 km, rising almost in a straight line. The named top five are at the top right, between 6 and 7 km.
Points against distance. On this course, points mostly came from covering ground.
Leg pace: one dot per leg run by anyone, minutes taken up and straight-line leg length across from 100 to 1,300 metres. Most legs are under 800 metres and 8 minutes. The top five competitors' legs are coloured along the bottom edge of the cloud.
Leg pace. The leaders’ legs sit along the bottom of the cloud: quick for their length.

When controls were visited is a grid: controls across, ten-minute blocks down, the number of visits in each square. It shows the field fanning out: the controls near the start are busy in the first ten minutes, and the far ones fill up later.
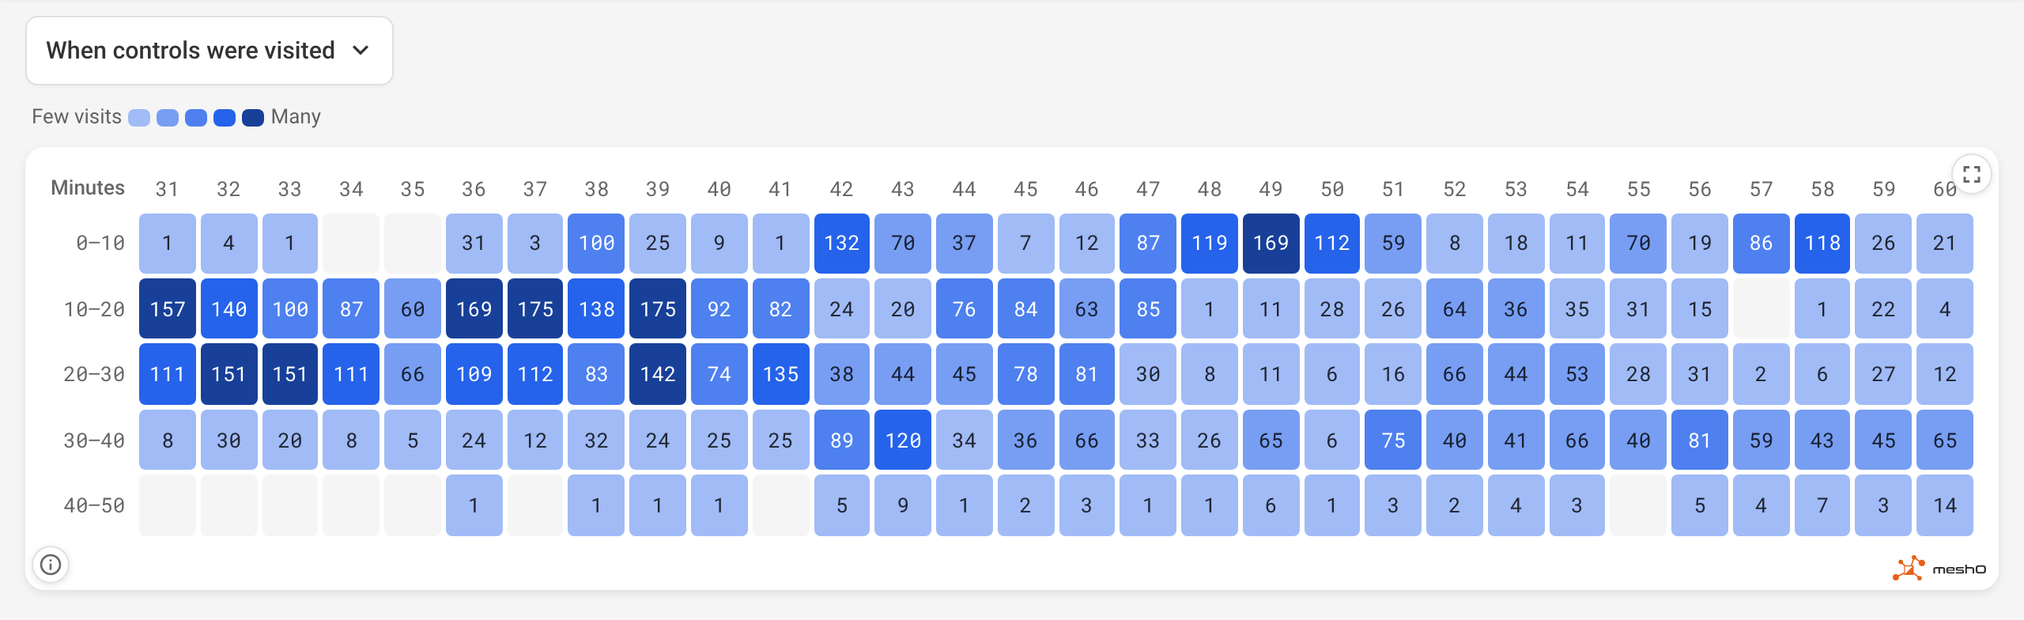
When controls were visited: a grid with controls 31 to 60 across and five ten-minute blocks down, each square holding the number of visits in that block and shaded darker for more. Controls 42, 48 and 49 are busiest in the first ten minutes; 31 to 39 between 10 and 30 minutes.
When controls were visited. 48 and 49, by the start, are busiest in the first ten minutes; the 50-point loop in the middle of the race.

Who came back late?

Finishing against the limit shows how close to 45 minutes the field came back. Blue is time to spare; red is late, and losing points. Here 56 of the 600 were over.
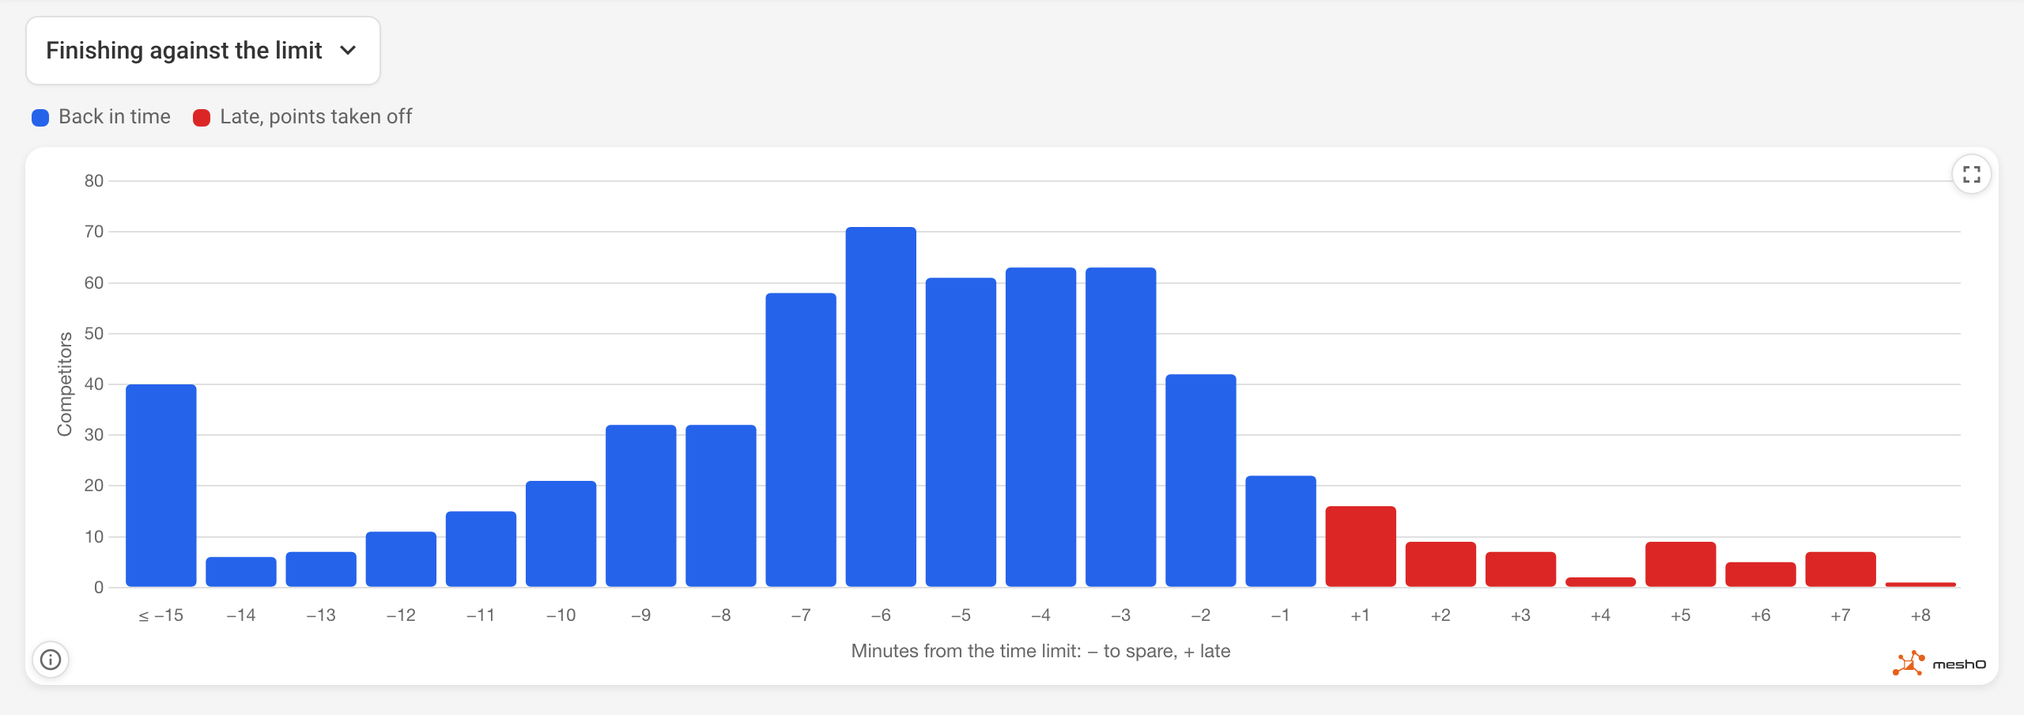
Finishing against the limit: bars for the number of competitors finishing at each minute from 15 or more minutes early to 8 minutes late. Most came back 2 to 7 minutes early, in blue. Small red bars from 1 to 8 minutes late show the competitors who lost points.
Finishing against the limit. Most of the field came back with 2 to 7 minutes to spare.

Points lost to lateness shows the ten competitors the penalty cost most, with what they collected and what it took off them. Niklas Foster collected 440 points and was back at 52:24: eight minutes late, 80 points gone. This graph only appears when somebody was late.
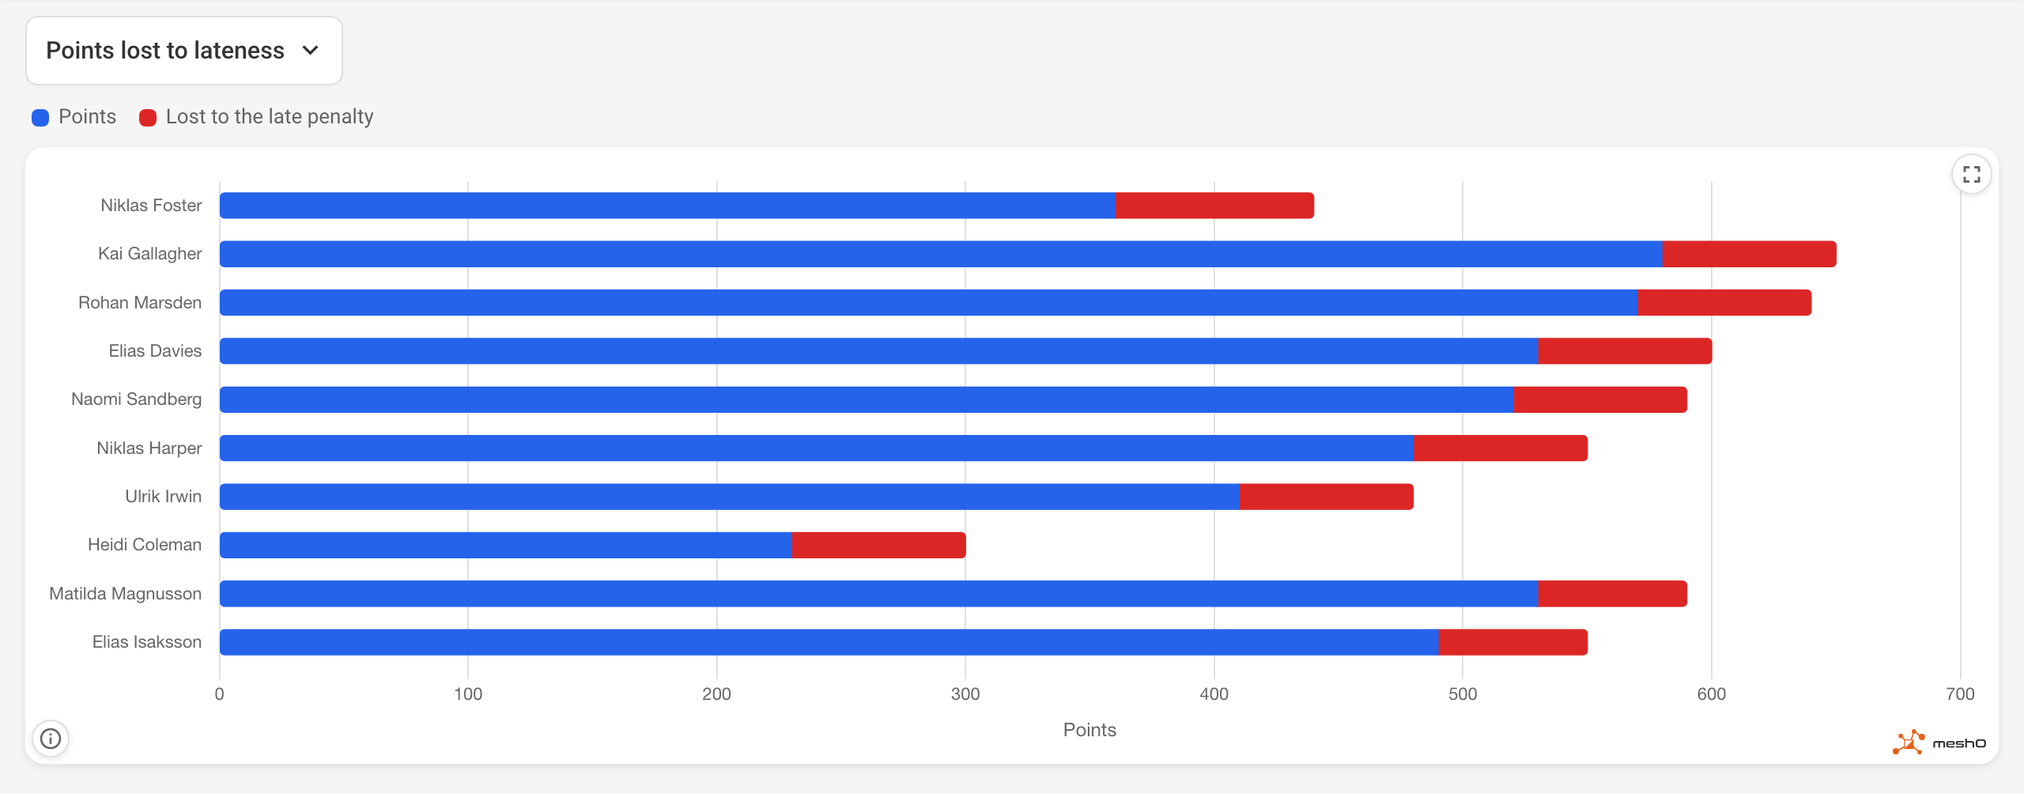
Points lost to lateness: a bar for each of ten competitors, blue for the points they kept and red for the points the late penalty took off. Niklas Foster kept 360 of 440, and Kai Gallagher, Rohan Marsden and others lost 60 to 80 points each.
Points lost to lateness. The red is what the penalty took.

And when more than one class runs the course, Points by class shows the spread of scores in each.
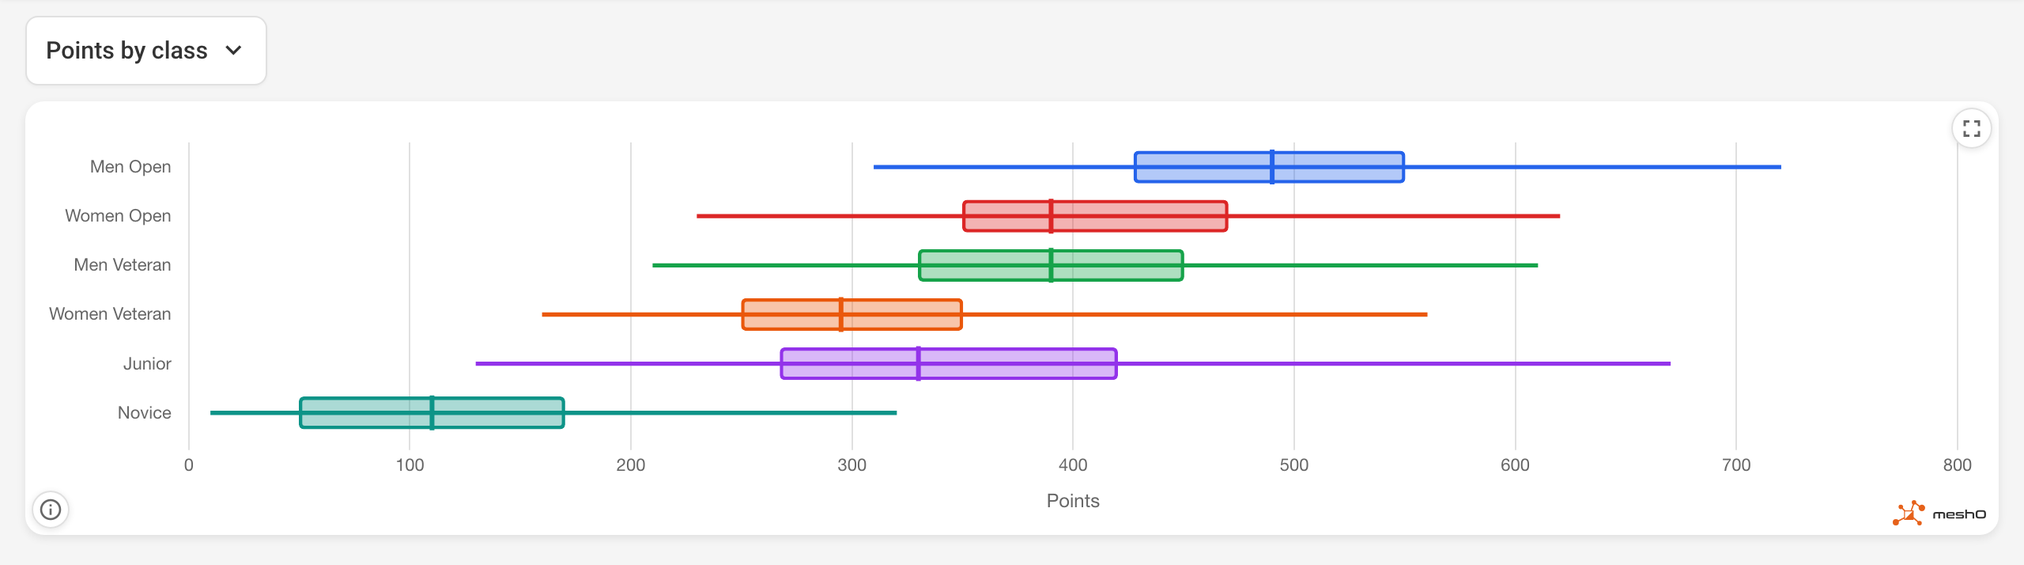
Points by class: a box plot for each of six classes, Men Open, Women Open, Men Veteran, Women Veteran, Junior and Novice, showing the range and middle half of their scores. Men Open's middle half is about 430 to 550 points; Novice's about 50 to 170.
Points by class: six classes on one course.

On a phone

The graphs are on the spectator site as well as the kiosk, so a competitor can open them on their phone at the finish. Competitors picks who the graphs about individuals show, the top five to start with. Tap a name in a graph’s key to pick that competitor out.
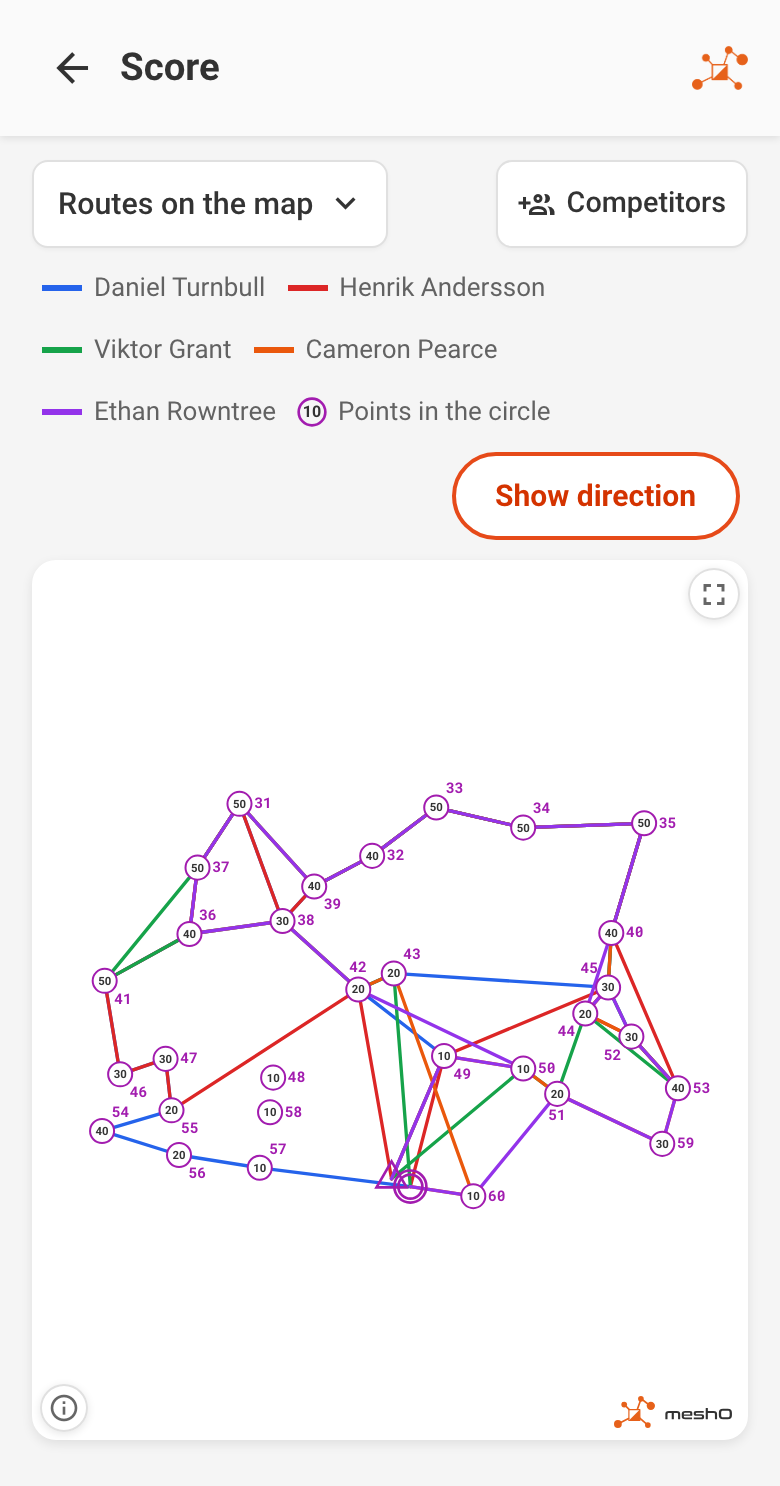
Routes on the map
Routes on the map on a phone: the Competitors button and the key of five names above the course drawn in purple, with the five routes drawn over it in colour.
Points over time
Points over time on a phone: five stepped lines climbing to between 660 and 720 points, with the time limit dotted at 45 minutes.

What you need

Nothing to turn on. Make a score course in Manager as usual, and the analysis page shows these graphs for it in place of the line-course ones.

Routes on the map, Points against distance and Leg pace need a position for the start, the finish and every control, from a Purple Pen import or controls placed on the event map. Without them those three are left out and Leg times is offered in their place, and Busiest legs becomes a ranked list of legs instead of lines over the course. Finishing against the limit needs a time limit.

The score graphs are in the next release of meshO Manager. To read what each one shows, see Score courses in the meshO Manager docs.
The meshO Manager newsletter

Every second week: new guides, posts and video tips for the people who run events with meshO Manager. Unsubscribe from any issue.

Subscribe by email

Opens an email to sales@mesho.live. Send it, and we add the address it comes from.

Related

Running an event? Tell us about it.

Hardware, software or the whole day — we’ll quote for what you need.